> ## Documentation Index
> Fetch the complete documentation index at: https://docs.nexalis.io/llms.txt
> Use this file to discover all available pages before exploring further.
# Excel Add-in
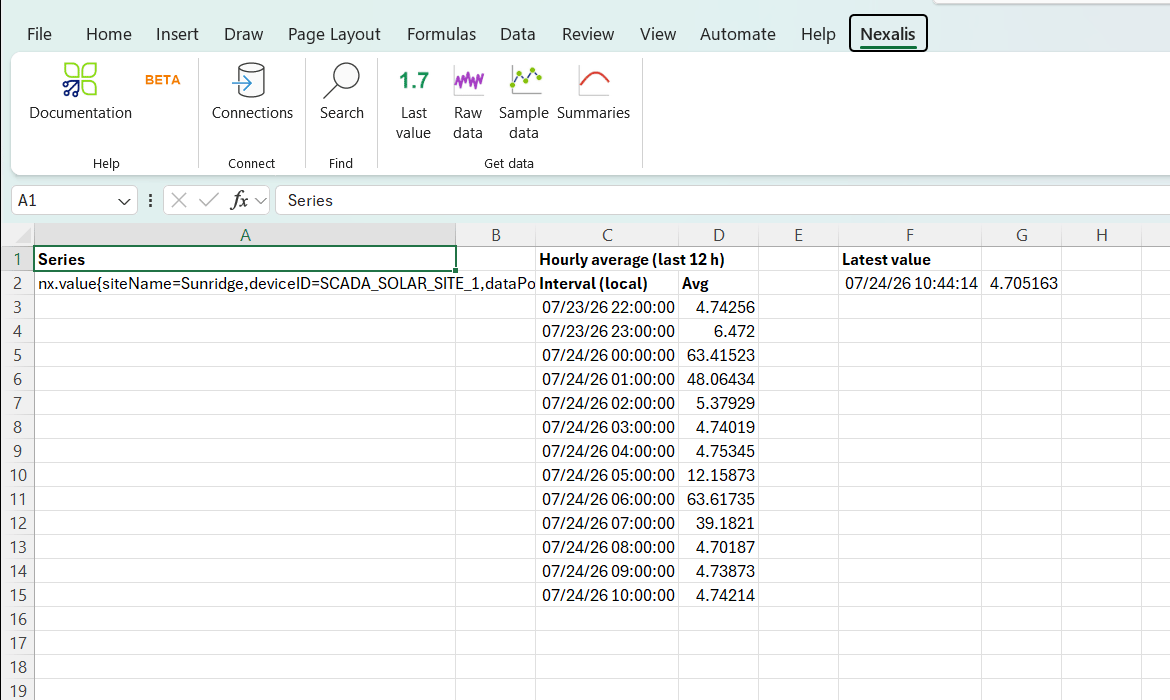
The Nexalis Excel add-in pulls time-series data from Nexalis Cloud directly into your worksheets. It adds a **Nexalis** ribbon tab for browsing your time series and building queries, plus a set of `NEXALIS.*` worksheet functions that stay live and recalculate with the sheet — so a workbook can be refreshed rather than rebuilt.
The add-in talks to the real-time API at `{endpoint}/api/v0/exec` over WarpScript. There is no server component to deploy — you install the add-in, save a connection, and start pulling data.
 The Excel add-in is currently a **preview (beta)** release. Features and function arguments may still change between builds.
***
## Requirements
* Windows
* Desktop Excel, **64-bit** (Microsoft 365, 2016, 2019 or 2021)
* A Nexalis Cloud endpoint URL and a **read token**
64-bit Excel running on an ARM-based PC works (it runs under emulation). The add-in does not support 32-bit Excel, native-ARM64 Excel, Excel for the web, or Excel for Mac.
***
## Installation
### Step 1: Download
Download the latest `Nexalis-AddIn-beta.zip` from the [releases repository](https://github.com/Nexalis-Organization/nexalis-excel-addin-releases/releases).
### Step 2: Run the installer
1. Unzip the download, keeping all the files together in one folder
2. Double-click **Install Nexalis add-in.bat**
3. Windows shows a blue **"Windows protected your PC"** box — click **More info**, then **Run anyway**
4. Close Excel completely, then reopen it
The installer needs no administrator rights. It copies the add-in into your user profile, registers it to load automatically when Excel starts, and adds a **Load Nexalis add-in** shortcut to your Start menu.
The security prompt appears because this preview build is signed with an in-house certificate rather than a public commercial one. The prompt is shown once, when you run the installer.
### Step 3: Confirm
Reopen Excel and look for the **Nexalis** tab in the ribbon. If it is missing, make sure Excel was fully closed first — a background `EXCEL.EXE` process left running in Task Manager will keep the old session alive. You can also load the add-in for the current session from the **Load Nexalis add-in** Start-menu shortcut.
If your Excel is configured to require add-ins signed by a trusted publisher, run **Trust Nexalis publisher.bat** once (included in the zip) and restart Excel.
### Updating
To update, run **Install Nexalis add-in.bat** again from the newer zip, then restart Excel. To remove the add-in, run **Uninstall Nexalis add-in.bat**.
***
## Connecting to Nexalis Cloud
Connections are saved per Windows user, so each person configures their own once.
The Excel add-in is currently a **preview (beta)** release. Features and function arguments may still change between builds.
***
## Requirements
* Windows
* Desktop Excel, **64-bit** (Microsoft 365, 2016, 2019 or 2021)
* A Nexalis Cloud endpoint URL and a **read token**
64-bit Excel running on an ARM-based PC works (it runs under emulation). The add-in does not support 32-bit Excel, native-ARM64 Excel, Excel for the web, or Excel for Mac.
***
## Installation
### Step 1: Download
Download the latest `Nexalis-AddIn-beta.zip` from the [releases repository](https://github.com/Nexalis-Organization/nexalis-excel-addin-releases/releases).
### Step 2: Run the installer
1. Unzip the download, keeping all the files together in one folder
2. Double-click **Install Nexalis add-in.bat**
3. Windows shows a blue **"Windows protected your PC"** box — click **More info**, then **Run anyway**
4. Close Excel completely, then reopen it
The installer needs no administrator rights. It copies the add-in into your user profile, registers it to load automatically when Excel starts, and adds a **Load Nexalis add-in** shortcut to your Start menu.
The security prompt appears because this preview build is signed with an in-house certificate rather than a public commercial one. The prompt is shown once, when you run the installer.
### Step 3: Confirm
Reopen Excel and look for the **Nexalis** tab in the ribbon. If it is missing, make sure Excel was fully closed first — a background `EXCEL.EXE` process left running in Task Manager will keep the old session alive. You can also load the add-in for the current session from the **Load Nexalis add-in** Start-menu shortcut.
If your Excel is configured to require add-ins signed by a trusted publisher, run **Trust Nexalis publisher.bat** once (included in the zip) and restart Excel.
### Updating
To update, run **Install Nexalis add-in.bat** again from the newer zip, then restart Excel. To remove the add-in, run **Uninstall Nexalis add-in.bat**.
***
## Connecting to Nexalis Cloud
Connections are saved per Windows user, so each person configures their own once.
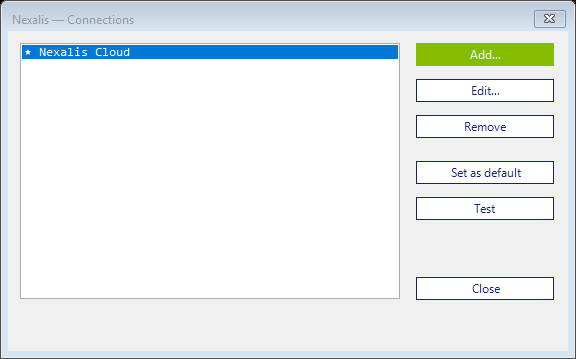 1. On the **Nexalis** ribbon tab, click **Connections**
2. Click **Add**, then fill in:
* **Name** — a short label, for example `Production`
* **URL** — your Nexalis Cloud base URL, for example `https://yourcompany.app.nexalis.io`
* **Token** — your Nexalis **read token**
3. Click **Test** to verify the endpoint answers and accepts the token
4. Click **Set as default** so new formulas use this connection
Saved connections are stored in `%APPDATA%\Warp10AddIn\endpoints.json`. Tokens are masked in the interface.
Use a **read** token. The add-in only queries data and never writes to your Nexalis instance.
***
## The Nexalis ribbon
1. On the **Nexalis** ribbon tab, click **Connections**
2. Click **Add**, then fill in:
* **Name** — a short label, for example `Production`
* **URL** — your Nexalis Cloud base URL, for example `https://yourcompany.app.nexalis.io`
* **Token** — your Nexalis **read token**
3. Click **Test** to verify the endpoint answers and accepts the token
4. Click **Set as default** so new formulas use this connection
Saved connections are stored in `%APPDATA%\Warp10AddIn\endpoints.json`. Tokens are masked in the interface.
Use a **read** token. The add-in only queries data and never writes to your Nexalis instance.
***
## The Nexalis ribbon
 | Button | What it does |
| --------------- | --------------------------------------------------------------------------------------- |
| **Connections** | Add, edit, remove and test saved endpoints, and pick the default |
| **Search** | Find time series by filtering on labels and attributes, then insert them into the sheet |
| **Last value** | Insert the most recent value of one or more series |
| **Raw data** | Insert every recorded point between two times |
| **Sample data** | Insert interpolated values at chosen times |
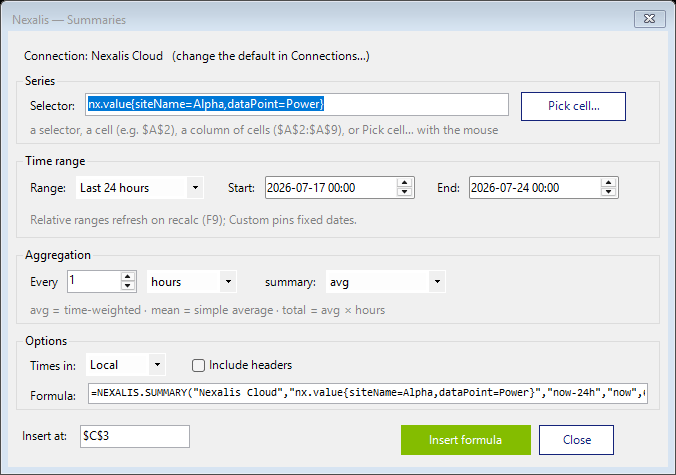
| **Summaries** | Insert aggregated buckets (average, total, min, max, …) |
Each button opens a small window where you choose the series and the time range, previews the formula it will write, and inserts it at the cell you pick.
| Button | What it does |
| --------------- | --------------------------------------------------------------------------------------- |
| **Connections** | Add, edit, remove and test saved endpoints, and pick the default |
| **Search** | Find time series by filtering on labels and attributes, then insert them into the sheet |
| **Last value** | Insert the most recent value of one or more series |
| **Raw data** | Insert every recorded point between two times |
| **Sample data** | Insert interpolated values at chosen times |
| **Summaries** | Insert aggregated buckets (average, total, min, max, …) |
Each button opens a small window where you choose the series and the time range, previews the formula it will write, and inserts it at the cell you pick.
 ***
## Finding your time series
Click **Search** to browse what is available on your connection.
***
## Finding your time series
Click **Search** to browse what is available on your connection.
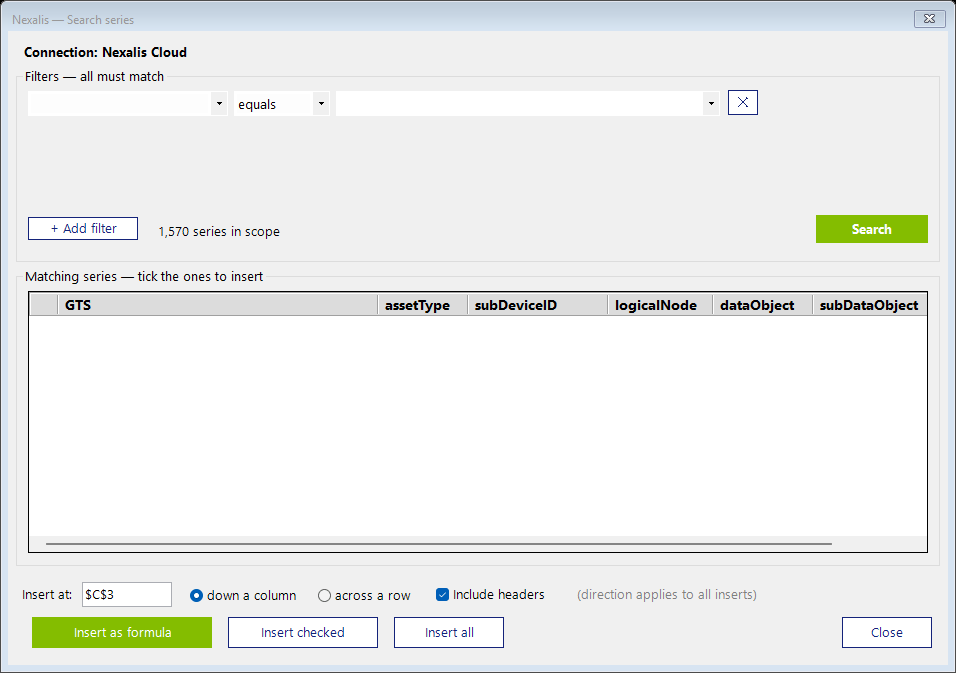 1. Add one or more filters — pick a **field** (a label or attribute such as `siteName`, `assetType` or `dataPoint`), an operator (**equals** or **contains**), and a **value**
2. Values are offered in a dropdown listing what actually exists in the narrowed set, so filters can be stacked to drill down
3. Click **Search** to list the matching series
The results grid shows the **GTS** selector for each series plus its `assetType`, `subDeviceID`, `logicalNode`, `dataObject`, `subDataObject` and `engUnits`.
You can then insert the result three ways:
* **Insert as formula** — writes a live `=NEXALIS.FIND(...)` built from your filters. The search criteria stay visible and editable in the cell, and the list refreshes when the sheet recalculates.
* **Insert checked** — writes the selectors of the rows you ticked, as static text
* **Insert all** — writes every matching selector, as static text
Choose **down a column** or **across a row** to control the direction, and **Include headers** to add a header row.
Inserting as a formula is the recommended approach: the search scope is recorded in the sheet, so you can see later what a list of series was based on — and change it without redoing the search.
***
## Worksheet functions
Every function takes the **connection name** as its first argument, and a **selector** identifying the series. A selector looks like `nx.value{siteName=Alpha,dataPoint=...}` — copy one from `NEXALIS.FIND`, or point the formula at a cell that contains one.
Selectors are long, so most workbooks keep them in one place and reference them. The cell (or range) you point at can live on **another sheet in the same workbook** — for example `Tags!$A$2` or `Tags!$A$2:$A$20`. A common layout is a dedicated `Tags` sheet holding the series list, with the reporting sheets referencing it.
| Function | Purpose |
| ----------------- | ------------------------------------------------------------------ |
| `NEXALIS.FIND` | List the series matching a set of filters |
| `NEXALIS.LAST` | Latest value of a series |
| `NEXALIS.FETCH` | Every recorded point between two times |
| `NEXALIS.SAMPLE` | Interpolated values at a regular interval, or at chosen timestamps |
| `NEXALIS.SUMMARY` | Aggregated buckets between two times |
### NEXALIS.FIND
```excel theme={null}
=NEXALIS.FIND(endpoint, [class], [labels], [attributes], [fields], [headers], [across])
```
Lists matching series. `labels` and `attributes` are comma-separated filters such as `siteName=Alpha` or `dataPoint=~.*INV.*` (a `~` prefix makes the value a regular expression).
* With **headers** `TRUE`, the result is a table: the GTS selector followed by one column per field, with a header row. `fields` defaults to `assetType, subDeviceID, logicalNode, dataObject, subDataObject, engUnits`.
* With **headers** `FALSE`, the result is a single column of GTS selectors — convenient to feed straight into the functions below.
* Set **across** `TRUE` to lay the result out across a row instead of down a column.
```excel theme={null}
=NEXALIS.FIND("Production", "nx.value", "siteName=Alpha", "engUnits=A", , TRUE)
```
### NEXALIS.LAST
```excel theme={null}
=NEXALIS.LAST(endpoint, selector, [labels], [timezone])
```
Returns the most recent value of every series matching the selector.
```excel theme={null}
=NEXALIS.LAST("Production", $A$2)
```
### NEXALIS.FETCH
```excel theme={null}
=NEXALIS.FETCH(endpoint, selector, [labels], start, end, [timezone])
```
Returns every recorded point between `start` and `end` (both included), as rows of timestamp and value. The selector must identify a single series.
```excel theme={null}
=NEXALIS.FETCH("Production", $A$2, , "now-24h", "now")
```
### NEXALIS.SAMPLE
Returns **interpolated** values at times you choose, which is useful when several series are recorded at different moments and you need them lined up on a common time base.
1. Add one or more filters — pick a **field** (a label or attribute such as `siteName`, `assetType` or `dataPoint`), an operator (**equals** or **contains**), and a **value**
2. Values are offered in a dropdown listing what actually exists in the narrowed set, so filters can be stacked to drill down
3. Click **Search** to list the matching series
The results grid shows the **GTS** selector for each series plus its `assetType`, `subDeviceID`, `logicalNode`, `dataObject`, `subDataObject` and `engUnits`.
You can then insert the result three ways:
* **Insert as formula** — writes a live `=NEXALIS.FIND(...)` built from your filters. The search criteria stay visible and editable in the cell, and the list refreshes when the sheet recalculates.
* **Insert checked** — writes the selectors of the rows you ticked, as static text
* **Insert all** — writes every matching selector, as static text
Choose **down a column** or **across a row** to control the direction, and **Include headers** to add a header row.
Inserting as a formula is the recommended approach: the search scope is recorded in the sheet, so you can see later what a list of series was based on — and change it without redoing the search.
***
## Worksheet functions
Every function takes the **connection name** as its first argument, and a **selector** identifying the series. A selector looks like `nx.value{siteName=Alpha,dataPoint=...}` — copy one from `NEXALIS.FIND`, or point the formula at a cell that contains one.
Selectors are long, so most workbooks keep them in one place and reference them. The cell (or range) you point at can live on **another sheet in the same workbook** — for example `Tags!$A$2` or `Tags!$A$2:$A$20`. A common layout is a dedicated `Tags` sheet holding the series list, with the reporting sheets referencing it.
| Function | Purpose |
| ----------------- | ------------------------------------------------------------------ |
| `NEXALIS.FIND` | List the series matching a set of filters |
| `NEXALIS.LAST` | Latest value of a series |
| `NEXALIS.FETCH` | Every recorded point between two times |
| `NEXALIS.SAMPLE` | Interpolated values at a regular interval, or at chosen timestamps |
| `NEXALIS.SUMMARY` | Aggregated buckets between two times |
### NEXALIS.FIND
```excel theme={null}
=NEXALIS.FIND(endpoint, [class], [labels], [attributes], [fields], [headers], [across])
```
Lists matching series. `labels` and `attributes` are comma-separated filters such as `siteName=Alpha` or `dataPoint=~.*INV.*` (a `~` prefix makes the value a regular expression).
* With **headers** `TRUE`, the result is a table: the GTS selector followed by one column per field, with a header row. `fields` defaults to `assetType, subDeviceID, logicalNode, dataObject, subDataObject, engUnits`.
* With **headers** `FALSE`, the result is a single column of GTS selectors — convenient to feed straight into the functions below.
* Set **across** `TRUE` to lay the result out across a row instead of down a column.
```excel theme={null}
=NEXALIS.FIND("Production", "nx.value", "siteName=Alpha", "engUnits=A", , TRUE)
```
### NEXALIS.LAST
```excel theme={null}
=NEXALIS.LAST(endpoint, selector, [labels], [timezone])
```
Returns the most recent value of every series matching the selector.
```excel theme={null}
=NEXALIS.LAST("Production", $A$2)
```
### NEXALIS.FETCH
```excel theme={null}
=NEXALIS.FETCH(endpoint, selector, [labels], start, end, [timezone])
```
Returns every recorded point between `start` and `end` (both included), as rows of timestamp and value. The selector must identify a single series.
```excel theme={null}
=NEXALIS.FETCH("Production", $A$2, , "now-24h", "now")
```
### NEXALIS.SAMPLE
Returns **interpolated** values at times you choose, which is useful when several series are recorded at different moments and you need them lined up on a common time base.
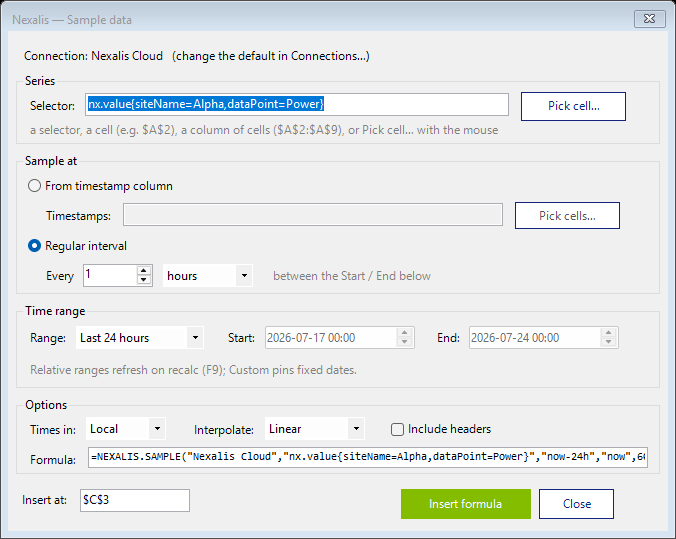 Sample at a regular interval between two times:
```excel theme={null}
=NEXALIS.SAMPLE(endpoint, selector, start, end, step_minutes, method, [timezone])
```
Or sample at a column of timestamps already in the sheet:
```excel theme={null}
=NEXALIS.SAMPLE(endpoint, selector, times, method, [timezone])
```
`method` is either `linear` (a straight line between the two surrounding recorded points) or `step` (carry the last known value forward). Times that fall outside the recorded data are returned blank rather than extrapolated.
```excel theme={null}
=NEXALIS.SAMPLE("Production", $A$2, "now-8h", "now", 15, "linear")
=NEXALIS.SAMPLE("Production", $A$2, $D$2:$D$50, "linear")
```
### NEXALIS.SUMMARY
```excel theme={null}
=NEXALIS.SUMMARY(endpoint, selector, start, end, interval_minutes, mode, [timezone])
```
Aggregates the data into fixed buckets. `mode` is one of `avg`, `total`, `min`, `max`, `mean`, `first` or `last`.
`avg` is time-weighted (the average of the signal over the bucket), `mean` is the plain arithmetic average of the recorded points, and `total` is `avg` multiplied by the bucket length in hours — the usual choice for energy from a power series.
```excel theme={null}
=NEXALIS.SUMMARY("Production", $A$2, "today", "now", 60, "avg")
```
### Utility functions
| Function | Purpose |
| ------------------------------------------------------- | ----------------------------------------------- |
| `=NEXALIS.ENDPOINTS()` | List the saved connections |
| `=NEXALIS.PING()` | Check an endpoint answers and accepts its token |
| `=NEXALIS.DIAG()` | Show add-in diagnostics, for troubleshooting |
| `=NEXALIS.SAVEENDPOINT()` / `=NEXALIS.REMOVEENDPOINT()` | Manage connections from a formula |
***
## Time inputs
Anywhere a time is expected you can give a date, a cell containing a date, or relative text:
| Text | Meaning |
| ----------- | ----------------------- |
| `now` | The current time |
| `now-24h` | 24 hours ago |
| `today` | Midnight this morning |
| `yesterday` | Midnight yesterday |
| `today-1d` | Midnight the day before |
Units are `s` (seconds), `m` (minutes), `h` (hours), `d` (days), `w` (weeks) and `mo` (months).
Relative times are plain text, so they are **non-volatile**: they resolve when the formula recalculates rather than continuously, which avoids the recalculation loops that volatile functions cause in large workbooks. Press F9 to refresh.
***
## Working with several series at once
`NEXALIS.SUMMARY` and `NEXALIS.SAMPLE` accept a **range of selector cells** instead of a single selector. They then return an aligned matrix: one timestamp column, then one value column per series, all sharing the same time base.
```excel theme={null}
=NEXALIS.SUMMARY("Production", $A$2:$A$8, "today", "now", 60, "avg", "local", , TRUE)
```
This pairs naturally with `NEXALIS.FIND`: use a `FIND` formula with headers off to produce a live column of selectors, then point a `SUMMARY` or `SAMPLE` formula at that column. Changing the search filters updates the series list, and the data below follows.
***
## Editing an existing formula
Right-click any cell containing a `NEXALIS.*` formula and choose **Edit Nexalis formula…**. The window it was built with reopens, pre-filled with the connection, series, time range and options from the formula. Adjust anything and insert again to rewrite it in place.
This works for `LAST`, `FETCH`, `SAMPLE` and `SUMMARY` formulas, and for `FIND` formulas inserted from **Search**.
***
## Troubleshooting
**The Nexalis tab does not appear.** Close Excel completely and confirm no `EXCEL.EXE` remains in Task Manager, then reopen it. Otherwise load it for the session from the **Load Nexalis add-in** Start-menu shortcut. If Excel is set to require signed add-ins, run **Trust Nexalis publisher.bat** from the zip.
**A formula returns "No series matched".** The selector may not exist on that connection. Check it with **Search**, or confirm you are pointing at the right connection — formulas name their connection explicitly, which may not be your default.
**A formula shows a warning starting with ⚠.** The message explains what to correct, most often a missing selector or a time range whose end falls before its start.
**Cells stay blank while a query runs.** Queries run in the background so Excel stays responsive; values appear when the data arrives. A blank cell in a `SAMPLE` result means there was no recorded data around that time to interpolate from.
**Values display as dates, or dates display as numbers.** The add-in formats timestamp columns as dates and value columns as General when a result spills. If you have applied your own formatting to those cells, it may conflict — clear the formatting and let the formula respill.
Sample at a regular interval between two times:
```excel theme={null}
=NEXALIS.SAMPLE(endpoint, selector, start, end, step_minutes, method, [timezone])
```
Or sample at a column of timestamps already in the sheet:
```excel theme={null}
=NEXALIS.SAMPLE(endpoint, selector, times, method, [timezone])
```
`method` is either `linear` (a straight line between the two surrounding recorded points) or `step` (carry the last known value forward). Times that fall outside the recorded data are returned blank rather than extrapolated.
```excel theme={null}
=NEXALIS.SAMPLE("Production", $A$2, "now-8h", "now", 15, "linear")
=NEXALIS.SAMPLE("Production", $A$2, $D$2:$D$50, "linear")
```
### NEXALIS.SUMMARY
```excel theme={null}
=NEXALIS.SUMMARY(endpoint, selector, start, end, interval_minutes, mode, [timezone])
```
Aggregates the data into fixed buckets. `mode` is one of `avg`, `total`, `min`, `max`, `mean`, `first` or `last`.
`avg` is time-weighted (the average of the signal over the bucket), `mean` is the plain arithmetic average of the recorded points, and `total` is `avg` multiplied by the bucket length in hours — the usual choice for energy from a power series.
```excel theme={null}
=NEXALIS.SUMMARY("Production", $A$2, "today", "now", 60, "avg")
```
### Utility functions
| Function | Purpose |
| ------------------------------------------------------- | ----------------------------------------------- |
| `=NEXALIS.ENDPOINTS()` | List the saved connections |
| `=NEXALIS.PING()` | Check an endpoint answers and accepts its token |
| `=NEXALIS.DIAG()` | Show add-in diagnostics, for troubleshooting |
| `=NEXALIS.SAVEENDPOINT()` / `=NEXALIS.REMOVEENDPOINT()` | Manage connections from a formula |
***
## Time inputs
Anywhere a time is expected you can give a date, a cell containing a date, or relative text:
| Text | Meaning |
| ----------- | ----------------------- |
| `now` | The current time |
| `now-24h` | 24 hours ago |
| `today` | Midnight this morning |
| `yesterday` | Midnight yesterday |
| `today-1d` | Midnight the day before |
Units are `s` (seconds), `m` (minutes), `h` (hours), `d` (days), `w` (weeks) and `mo` (months).
Relative times are plain text, so they are **non-volatile**: they resolve when the formula recalculates rather than continuously, which avoids the recalculation loops that volatile functions cause in large workbooks. Press F9 to refresh.
***
## Working with several series at once
`NEXALIS.SUMMARY` and `NEXALIS.SAMPLE` accept a **range of selector cells** instead of a single selector. They then return an aligned matrix: one timestamp column, then one value column per series, all sharing the same time base.
```excel theme={null}
=NEXALIS.SUMMARY("Production", $A$2:$A$8, "today", "now", 60, "avg", "local", , TRUE)
```
This pairs naturally with `NEXALIS.FIND`: use a `FIND` formula with headers off to produce a live column of selectors, then point a `SUMMARY` or `SAMPLE` formula at that column. Changing the search filters updates the series list, and the data below follows.
***
## Editing an existing formula
Right-click any cell containing a `NEXALIS.*` formula and choose **Edit Nexalis formula…**. The window it was built with reopens, pre-filled with the connection, series, time range and options from the formula. Adjust anything and insert again to rewrite it in place.
This works for `LAST`, `FETCH`, `SAMPLE` and `SUMMARY` formulas, and for `FIND` formulas inserted from **Search**.
***
## Troubleshooting
**The Nexalis tab does not appear.** Close Excel completely and confirm no `EXCEL.EXE` remains in Task Manager, then reopen it. Otherwise load it for the session from the **Load Nexalis add-in** Start-menu shortcut. If Excel is set to require signed add-ins, run **Trust Nexalis publisher.bat** from the zip.
**A formula returns "No series matched".** The selector may not exist on that connection. Check it with **Search**, or confirm you are pointing at the right connection — formulas name their connection explicitly, which may not be your default.
**A formula shows a warning starting with ⚠.** The message explains what to correct, most often a missing selector or a time range whose end falls before its start.
**Cells stay blank while a query runs.** Queries run in the background so Excel stays responsive; values appear when the data arrives. A blank cell in a `SAMPLE` result means there was no recorded data around that time to interpolate from.
**Values display as dates, or dates display as numbers.** The add-in formats timestamp columns as dates and value columns as General when a result spills. If you have applied your own formatting to those cells, it may conflict — clear the formatting and let the formula respill.