> ## Documentation Index
> Fetch the complete documentation index at: https://docs.nexalis.io/llms.txt
> Use this file to discover all available pages before exploring further.
# Grafana Plugin
The Nexalis Grafana plugin turns your Nexalis Cloud endpoint into a Grafana data source. You build queries by picking a site, an asset type and a measurement from dropdowns — the plugin writes the WarpScript for you, converts the result into Grafana time series, and labels the axis with the engineering units from the Nexalis data model.
It is a **backend** plugin: Grafana's own server calls the real-time API at `{endpoint}/api/v0/exec`. Your READ token is stored encrypted by Grafana and never reaches the browser.
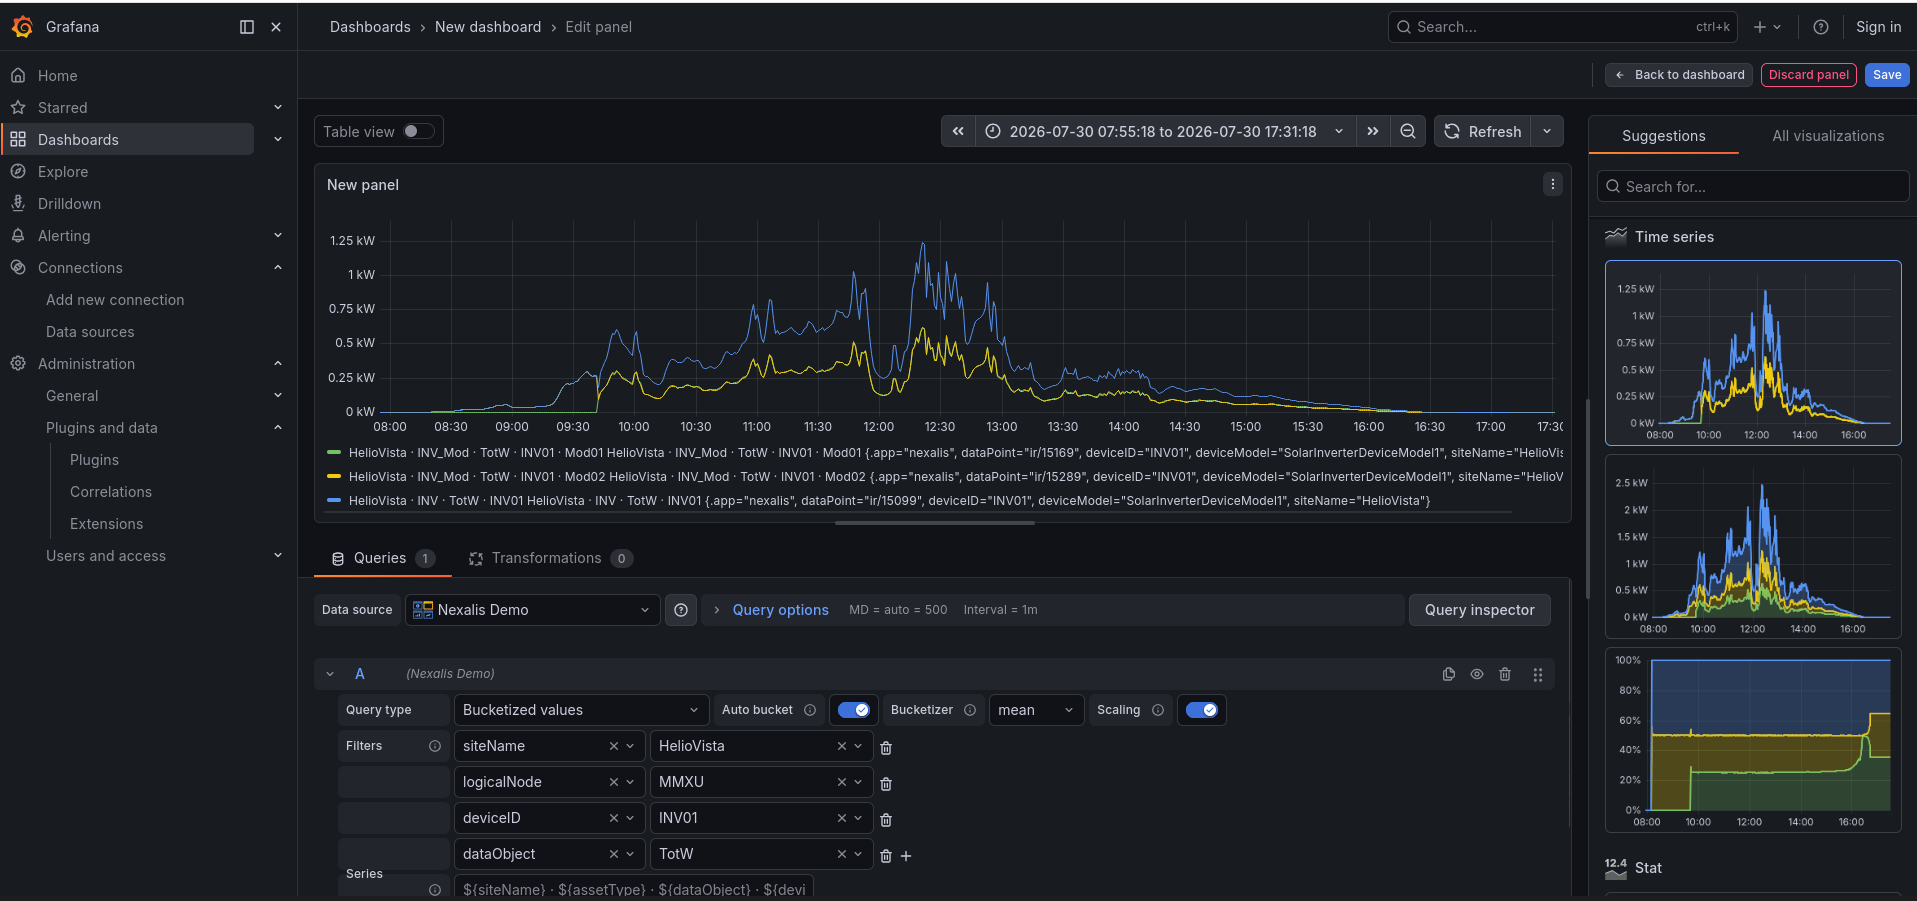 Everything in that panel came from the four filter rows at the bottom. Three things worth noticing, because none of them are panel settings you have to configure:
* **The y-axis reads kW.** The unit comes from the `engUnits` attribute in the Nexalis data model, applied to the field automatically.
* **The legend names itself** from the series-name template — site, asset type, measurement, device and sub-device, with any part a series does not have dropped.
* **Auto bucket** resolved to the 1-minute step Grafana asked for, shown as `Interval = 1m` under Query options. Widen the time range and the bucket widens with it, so the amount of data crossing the wire stays roughly constant.
The Grafana plugin is currently a **preview (beta)** release. Query options and the saved query format may still change between builds, so a dashboard built now may need small adjustments after an upgrade. Please send feedback and issues to [contact@nexalis.io](mailto:contact@nexalis.io).
**What you get**
* A point-and-click query editor — no WarpScript knowledge required
* Filter dropdowns populated from your own tenant, each one narrowed by the filters you already picked
* The Nexalis macros (`@nexalis/fetch_bucketized`, `@nexalis/fetch_trapezoidal_averages`, `@nexalis/scale`) exposed as query types
* Dashboard variables driven by your real site and device lists
* A raw WarpScript editor for anything the query builder does not cover
***
## Requirements
* **Grafana 12.3 or newer**, self-hosted (OSS or Enterprise)
* Access to the Grafana server's filesystem, and the ability to restart it
* A Nexalis Cloud endpoint URL and a **READ token**
* Outbound HTTPS from the Grafana server to your endpoint
The release contains backends for Linux, macOS and Windows, on both amd64 and arm64, so one download works everywhere.
**Grafana Cloud is not supported yet.** Grafana Cloud only runs plugins signed and published in the Grafana catalog, and this plugin is not yet signed. Use a self-hosted Grafana for now.
***
## Installation
Whichever way you run Grafana, the shape is the same: put the plugin folder where Grafana looks for plugins, tell Grafana to trust it because it is not signed yet, and restart. Only the mechanics differ, so pick the track that matches your setup:
* **[Grafana as a system package](#track-a-grafana-installed-as-a-package)** — installed with `apt` or `yum`, managed by `systemd`
* **[Grafana in Docker](#track-b-grafana-in-docker)** — `docker run` or Docker Compose
### Step 1: Find the latest version (both tracks)
Open the [releases repository](https://github.com/Nexalis-Organization/nexalis-grafana-plugin-releases/releases) and note the version number of the newest release — the tag looks like `v1.1.0`, and the download is `nexalis-nexalis-datasource-1.1.0.zip`.
Each release also publishes a `.zip.sha1` file if you want to verify the download:
```bash theme={null}
sha1sum -c nexalis-nexalis-datasource-1.1.0.zip.sha1
```
Whatever you do, keep the `nexalis-nexalis-datasource/` folder name from the zip. Grafana identifies a plugin by the `plugin.json` inside its own folder — renaming or flattening the folder stops it loading.
***
## Track A: Grafana installed as a package
### A1. Unzip into the plugins directory
The default is `/var/lib/grafana/plugins`. To confirm the path your server actually uses, ask Grafana — it logs every path at startup:
```bash theme={null}
journalctl -u grafana-server | grep "Path Plugins"
```
**On a fresh Grafana this directory does not exist yet.** Grafana creates `/var/lib/grafana` for its database, but `plugins/` only appears once a plugin has been installed, so `cd /var/lib/grafana/plugins` fails with *"No such file or directory"*. The `mkdir -p` below handles that.
```bash theme={null}
VERSION=1.1.0 # the version from Step 1, without the leading "v"
PLUGINS=/var/lib/grafana/plugins
sudo mkdir -p "$PLUGINS"
curl -sSL -o /tmp/nexalis-plugin.zip \
"https://github.com/Nexalis-Organization/nexalis-grafana-plugin-releases/releases/download/v$VERSION/nexalis-nexalis-datasource-$VERSION.zip"
sudo unzip -q /tmp/nexalis-plugin.zip -d "$PLUGINS"
rm /tmp/nexalis-plugin.zip
sudo chown -R grafana:grafana "$PLUGINS/nexalis-nexalis-datasource"
```
The download goes to `/tmp` as your own user, and only the unzip needs `sudo` — the plugins directory is owned by root. The final `chown` matters: Grafana runs as the `grafana` user and silently skips a plugin directory it cannot read.
You should end up with a `nexalis-nexalis-datasource/` folder containing `plugin.json`, `module.js` and several `gpx_nexalis_datasource_*` backend binaries.
### A2. Allow the plugin to load
The plugin is not signed yet, so add its ID to `grafana.ini`:
```ini theme={null}
[plugins]
allow_loading_unsigned_plugins = nexalis-nexalis-datasource
```
If you already allow other unsigned plugins, add this ID to the existing comma-separated list rather than replacing it.
### A3. Restart Grafana
```bash theme={null}
sudo systemctl restart grafana-server
```
Grafana reads `plugin.json` only at startup, so a restart is required — after this install and after every upgrade. Now jump to [Confirm Grafana found it](#confirm-grafana-found-it).
### Updating (package)
Replace the folder with the newer release and restart:
```bash theme={null}
VERSION=1.2.0 # the version you are moving to
PLUGINS=/var/lib/grafana/plugins
curl -sSL -o /tmp/nexalis-plugin.zip \
"https://github.com/Nexalis-Organization/nexalis-grafana-plugin-releases/releases/download/v$VERSION/nexalis-nexalis-datasource-$VERSION.zip"
sudo rm -rf "$PLUGINS/nexalis-nexalis-datasource"
sudo unzip -q /tmp/nexalis-plugin.zip -d "$PLUGINS"
rm /tmp/nexalis-plugin.zip
sudo chown -R grafana:grafana "$PLUGINS/nexalis-nexalis-datasource"
sudo systemctl restart grafana-server
```
Deleting the old folder rather than unzipping over it matters — it clears out files a newer release no longer ships. Your data sources and dashboards live in Grafana's own database, so they survive the upgrade untouched, and `grafana.ini` does not need changing again.
### Removing (package)
```bash theme={null}
sudo rm -rf /var/lib/grafana/plugins/nexalis-nexalis-datasource
sudo systemctl restart grafana-server
```
Then drop the ID from `allow_loading_unsigned_plugins`.
***
## Track B: Grafana in Docker
Nothing is installed *inside* the container. You unpack the plugin on the host and mount that one folder in, which means an upgrade is a host-side file swap plus a container restart.
### B1. Unpack the plugin on the host
Pick a directory you control — this example uses `./grafana-plugins` next to your `docker-compose.yml`:
```bash theme={null}
VERSION=1.1.0 # the version from Step 1, without the leading "v"
mkdir -p ./grafana-plugins
curl -sSL -o /tmp/nexalis-plugin.zip \
"https://github.com/Nexalis-Organization/nexalis-grafana-plugin-releases/releases/download/v$VERSION/nexalis-nexalis-datasource-$VERSION.zip"
unzip -q /tmp/nexalis-plugin.zip -d ./grafana-plugins
rm /tmp/nexalis-plugin.zip
chmod -R a+rX ./grafana-plugins/nexalis-nexalis-datasource
chmod +x ./grafana-plugins/nexalis-nexalis-datasource/gpx_*
```
The official `grafana/grafana` image runs as **UID 472**, not root, and host file ownership is not translated into the container. If the plugin folder is not readable by that UID, Grafana skips it with no visible error. `chmod -R a+rX` is the simplest fix; `sudo chown -R 472:472` also works. The `chmod +x` matters too — a backend plugin whose binary is not executable fails to start.
### B2. Mount it and allow it
```yaml theme={null}
services:
grafana:
image: grafana/grafana:12.3.0 # or newer; 12.3 is the minimum
ports:
- "3000:3000"
environment:
GF_PLUGINS_ALLOW_LOADING_UNSIGNED_PLUGINS: nexalis-nexalis-datasource
volumes:
- ./grafana-plugins/nexalis-nexalis-datasource:/var/lib/grafana/plugins/nexalis-nexalis-datasource
- grafana-data:/var/lib/grafana
volumes:
grafana-data:
```
`GF_PLUGINS_ALLOW_LOADING_UNSIGNED_PLUGINS` is the environment-variable form of the `grafana.ini` setting — in Docker you never edit the file.
Two details worth getting right:
* **Mount the plugin's own folder, not the whole `plugins` directory.** Mounting the parent would hide any other plugin the image ships with.
* **Give `/var/lib/grafana` a named volume.** Without it, your data sources and dashboards are inside the container's writable layer and disappear the moment you recreate it — which is exactly what an upgrade does.
The equivalent as a one-off `docker run`, useful for a quick trial:
```bash theme={null}
docker run --rm -p 3000:3000 -e GF_PLUGINS_ALLOW_LOADING_UNSIGNED_PLUGINS=nexalis-nexalis-datasource -v "$PWD/grafana-plugins/nexalis-nexalis-datasource:/var/lib/grafana/plugins/nexalis-nexalis-datasource" grafana/grafana:12.3.0
```
### B3. Start it
```bash theme={null}
docker compose up -d
```
Then jump to [Confirm Grafana found it](#confirm-grafana-found-it). If the data source is missing, the container log usually says why:
```bash theme={null}
docker compose logs grafana | grep -i nexalis
```
### Updating (Docker)
Replace the folder on the host, then restart the container. Grafana reads `plugin.json` only at startup, so the restart is what actually applies the new version:
```bash theme={null}
VERSION=1.2.0 # the version you are moving to
curl -sSL -o /tmp/nexalis-plugin.zip \
"https://github.com/Nexalis-Organization/nexalis-grafana-plugin-releases/releases/download/v$VERSION/nexalis-nexalis-datasource-$VERSION.zip"
rm -rf ./grafana-plugins/nexalis-nexalis-datasource
unzip -q /tmp/nexalis-plugin.zip -d ./grafana-plugins
rm /tmp/nexalis-plugin.zip
chmod -R a+rX ./grafana-plugins/nexalis-nexalis-datasource
chmod +x ./grafana-plugins/nexalis-nexalis-datasource/gpx_*
docker compose restart grafana
```
The compose file does not change, and neither do your data sources and dashboards as long as `/var/lib/grafana` is on a named volume.
### Removing (Docker)
Delete the `volumes:` line for the plugin from your compose file, then:
```bash theme={null}
docker compose up -d --force-recreate grafana
rm -rf ./grafana-plugins/nexalis-nexalis-datasource
```
***
## Confirm Grafana found it
In Grafana, go to **Connections → Data sources → Add new data source** and search for `Nexalis`. If it appears, the plugin is loaded — continue to [Connecting to Nexalis Cloud](#connecting-to-nexalis-cloud).
To check the version that is actually running, open **Administration → Plugins** and search for Nexalis.
If it does not appear at all, see [The Nexalis data source does not appear](#the-nexalis-data-source-does-not-appear).
***
## Connecting to Nexalis Cloud
Go to **Connections → Data sources → Add new data source** and choose **Nexalis**. There are only two fields to fill in:
| Field | Value |
| --------------- | --------------------------------------------------------------- |
| **Nexalis URL** | Your endpoint, for example `https://yourcompany.app.nexalis.io` |
| **READ token** | Your Nexalis READ token |
Then click **Save & test**.
A working configuration reports how many time series the token can see:
```
Connected — 48213 time series visible with this token
```
That number is your whole tenant, counted by the API itself — it is a quick confirmation that both the endpoint and the token are right.
Use a **READ** token. The plugin only ever queries data and never writes to your Nexalis instance.
The token is stored in Grafana's encrypted secrets store. Once saved it is write-only: the field shows `configured` and you can replace it, but neither the browser nor a dashboard viewer can read it back.
The **Nexalis URL** field accepts either the base URL (`https://yourcompany.app.nexalis.io`) or the full exec URL (`https://yourcompany.app.nexalis.io/api/v0/exec`) — the plugin normalises it either way.
### Provisioning instead of clicking
To create the data source from configuration, drop a file in Grafana's `provisioning/datasources/` directory:
```yaml theme={null}
apiVersion: 1
datasources:
- name: Nexalis
type: nexalis-nexalis-datasource
access: proxy
isDefault: true
jsonData:
nexalisUrl: https://yourcompany.app.nexalis.io
secureJsonData:
token: $NEXALIS_READ_TOKEN
```
Set `NEXALIS_READ_TOKEN` in the Grafana server's environment so the token is not committed to your configuration repository.
***
## Your first panel
This builds a chart of inverter AC power for one site, from an empty dashboard.
1. Go to **Dashboards → New → New dashboard**, then click **+ Add visualization**
2. Choose your **Nexalis** data source
The query editor opens with **Query type** set to **Bucketized values** and one empty filter row keyed on `siteName`.
3. Click the **value** box on that first filter row
The dropdown lists the real site names in your tenant. Pick one.
4. Click the **+** button at the end of the row to add a second filter. Set the key to `assetType` and the value to `INV`
5. Add a third filter: key `dataObject`, value `TotW`
6. Set the dashboard time range in the top right to **Last 6 hours**
7. Click the refresh button
You should now see one line per inverter, each named from its site, asset type, measurement and device, with the y-axis already in **kW** — the plugin reads `engUnits` from the Nexalis data model and applies it to the panel. The screenshot at the top of this page shows the same thing, narrowed further with `logicalNode` and `deviceID` filters as well.
Click **Save** to keep the dashboard.
A filter with an **empty value** matches nothing, which is why a brand-new panel shows no data until you fill in that first value. If a panel goes empty after an edit, check that every filter row you have added has a value.
Grafana's **Explore** page (in the left-hand menu) has the same query editor without the dashboard around it. It is the quickest way to try filters out, or to check that a tag has recent data, before committing to a panel.
***
## The query editor
### Query types
| Query type | What it runs | Use it for |
| ------------------------ | ------------------------------------- | ------------------------------------------------------------------------------------------------------------- |
| **Bucketized values** | `@nexalis/fetch_bucketized` | The default. Resamples into fixed buckets using `mean`, `last`, `first`, `max` or `min`. Best for dashboards. |
| **Trapezoidal averages** | `@nexalis/fetch_trapezoidal_averages` | Time-weighted averages per bucket. The accurate choice when data is sampled irregularly. |
| **Raw values (scaled)** | `FETCH` + `@nexalis/scale` | Every recorded point. Use on short time ranges only. |
| **Discover (FIND)** | `FIND` | Lists the distinct values of one label or attribute. Drives dashboard variables. |
| **Raw WarpScript** | your script | Anything the builder does not cover. |
Bucketized and trapezoidal are the two you will use most. Both aggregate server-side, so the amount of data crossing the wire stays roughly constant however long a time range you pick.
### Filters
Filters are the heart of a query. Each row is one key and one value, and all rows are combined — a query matches series that satisfy every row.
Nexalis stores two kinds of metadata on a time series, **labels** and **attributes**, and both are filterable here in exactly the same way:
| Key | Kind | Example |
| ----------------- | --------- | --------------------------------------------------------------------------- |
| `siteName` | label | `TX_001` |
| `deviceID` | label | `01234` |
| `deviceModel` | label | `Satcon` |
| `dataPoint` | label | `42`, or an OPC UA path such as `ns=2;s=[PLANT1]/PV/BLK-06/INV-06/VAL_P_KW` |
| `assetType` | attribute | `INV`, `Meter`, `MeteoSta` |
| `subDeviceID` | attribute | `BLK_001_23` |
| `logicalNode` | attribute | `MMXU`, `MMDC` |
| `dataObject` | attribute | `TotW`, `PhV` |
| `subDataObject` | attribute | `phsA` |
| `measurementType` | attribute | `Analog`, `Discrete` |
See [Data Structure](./real-time-api#data-structure) for what each one means.
Both the key and the value dropdowns are populated from your tenant, and **the value list is narrowed by the filters you have already set** — pick `siteName` first and the `assetType` dropdown then offers only the asset types that exist at that site. Building a query top to bottom keeps every choice valid.
You can also type instead of picking:
* **A Warp10 regular expression**, prefixed with `~` — `~INV-(1|2)`, `~^TX_`, `~.*_001$`. See [Filtering Data](./real-time-api#filtering-data).
* **A dashboard variable** — `$site`. See [Dashboard variables](#dashboard-variables) below.
If a value list is longer than the plugin will show at once, it tells you so in the dropdown; type to search, or add another filter to narrow it.
### Bucket size
**Auto bucket** is on for new queries. The bucket width then follows the panel's time range and width the way Grafana's `$__interval` does, snapping to a fixed ladder — 1, 2, 5, 10, 15, 30, 60, 120, 180, 360, 720 or 1440 minutes — so buckets do not shift around as you resize a panel.
Turn **Auto bucket** off to pin a width in minutes, which is what you want when a number has to mean something specific: 15-minute averages for a settlement report, say, regardless of how the panel is displayed.
### Bucketizer
For **Bucketized values**, the **Bucketizer** field decides how the points inside each bucket are reduced to one value:
| Bucketizer | Result |
| ------------- | ------------------------------------------------------------------------------ |
| `mean` | Arithmetic average of the points in the bucket. The default. |
| `last` | The most recent point in the bucket — best for counters, states and totalisers |
| `first` | The earliest point in the bucket |
| `max` / `min` | The extreme value in the bucket — for peaks and dips a mean would hide |
If what you actually need is a *time-weighted* average — the true average of the signal over the bucket, rather than of the samples — use the **Trapezoidal averages** query type instead. On irregularly-sampled tags the two give different answers, and the trapezoidal one is the correct one.
### Scaling
**Scaling** is on by default and applies `@nexalis/scale`, which converts each raw SCADA value into the engineering units of the Nexalis data model using the `multiplier` and `adder` attributes — watts to kilowatts, for instance. Leave it on unless you specifically want the raw stored values.
Scaling is not idempotent. If you write a **Raw WarpScript** query, call `@nexalis/scale` exactly once — `@nexalis/fetch_bucketized` and `@nexalis/fetch_trapezoidal_averages` already apply it for you.
### Series name
**Series name** controls the legend. It is a template with `${...}` placeholders, and any label or attribute can be used:
```
${siteName} · ${assetType} · ${dataObject} · ${deviceID} · ${subDeviceID}
```
That is the default. Placeholders that a series does not have are dropped, along with the separator around them, so you never get a legend full of gaps. Shorten it to just what distinguishes your series — with one site and one measurement on a panel, `${subDeviceID}` alone is usually the readable choice.
***
## Dashboard variables
A variable turns a hard-coded filter into a dropdown at the top of the dashboard.
1. Open **Dashboard settings → Variables → Add variable**
2. Set **Select variable type** to **Query** and give it a name, for example `site`
3. Choose your **Nexalis** data source
4. Set **Query type** to **Discover (FIND)**
5. Set **Return values of** to `siteName`
6. Check the preview at the bottom of the page — it lists your actual site names
7. **Apply**, then use it in any panel by typing `$site` as a filter value
The same works for any key: point **Return values of** at `assetType`, `deviceID` or `dataObject` to build those dropdowns. Add filters to the variable query to make one variable depend on another — give the `deviceID` variable a filter of `siteName` = `$site`, and it will only ever list devices at the selected site.
**Multi-value and "All"** work. The plugin translates a multiple selection into a Warp10 regular expression (`~^(TX_001|TX_002)$`), because Warp10 has no list syntax of its own. You do not have to do anything — write `$site` as the filter value and select as many as you like.
***
## Raw WarpScript
Choose **Raw WarpScript** as the query type to write the script yourself. The filter builder is hidden — your script defines its own selectors. The plugin injects your saved token and the panel's time range, so a script can be moved between dashboards and time ranges unchanged:
| Variable | Contents |
| ----------------------- | ------------------------------------------- |
| `$token` | The configured READ token |
| `$start` / `$end` | The panel's time range, in microseconds |
| `$startISO` / `$endISO` | The same range as ISO 8601 strings |
| `$interval` | The step Grafana asked for, in microseconds |
| `$span` | `end` − `start`, in microseconds |
```warpscript theme={null}
{
'token' $token
'class' 'nx.value'
'labels' { 'siteName' 'TX_001' 'dataObject' 'TotW' }
'start' $startISO
'end' $endISO
} FETCH
@nexalis/scale
```
Leave Geo Time Series on the stack and the plugin turns them into panel series, exactly as it does for the built-in query types. Anything the [real-time API](./real-time-api) accepts works here, including your own macros.
***
## Query performance
Nexalis is a time-series database: it is fast at reading **one tag over a long period**, and slow at reading many tags at once. The [best practices](./real-time-api#best-practices) apply directly to how you build panels.
* **Filter as narrowly as you can.** Every filter you add cuts the number of series the API has to scan. Always set `siteName`; add `deviceID` or `dataPoint` when you know them.
* **One chart, one question.** A panel filtered only by `siteName` and `assetType` can match thousands of series. When a query returns more than 500, the panel shows a warning explaining that this is why it is slow — treat it as a prompt to add a filter, not as an error.
* **Prefer the aggregating query types.** Bucketized and trapezoidal aggregate server-side. **Raw values (scaled)** returns every recorded point, which on a high-frequency tag over a week is an enormous amount of data.
* **Mind the dashboard refresh rate.** Every panel is a separate API call. A dashboard of twenty panels refreshing every ten seconds is 120 calls a minute, which can hit your rate limit.
***
## Troubleshooting
### The Nexalis data source does not appear
Grafana logs a reason at startup. Check it first — it usually names the problem outright:
```bash theme={null}
journalctl -u grafana-server | grep -i plugin # package install
docker compose logs grafana | grep -i plugin # Docker
```
Then work through:
* **Was Grafana restarted** after the plugin was unzipped? `plugin.json` is read only at startup.
* **Is the folder in the right place**, and still named `nexalis-nexalis-datasource`? The `plugin.json` must be at `/nexalis-nexalis-datasource/plugin.json`, not one level deeper. Unzipping a second time can produce a nested duplicate folder.
* **Is the plugin allowed?** A signature error in the log means `allow_loading_unsigned_plugins` is missing the ID, or — in Docker — that `GF_PLUGINS_ALLOW_LOADING_UNSIGNED_PLUGINS` is missing or misspelled.
* **Are the backend binaries executable?** A "failed to start plugin" error usually means the `gpx_*` files lost their executable bit. Run `chmod +x /nexalis-nexalis-datasource/gpx_*`.
* **Can Grafana read the folder?** On a package install it must be readable by the `grafana` user. In Docker it must be readable by **UID 472**, which host ownership does not translate to — `chmod -R a+rX` on the host folder is the quick fix.
* **In Docker, is the mount actually there?** Confirm what the container sees:
```bash theme={null}
docker compose exec grafana ls -l /var/lib/grafana/plugins/nexalis-nexalis-datasource
```
An empty or missing directory means the `volumes:` path is wrong — it is resolved relative to the compose file, not to your shell.
### "Save & test" fails
| Message | What to do |
| -------------------------------------------------- | ------------------------------------------------------------------------------------------------------------------------------------------------- |
| `Nexalis URL is missing` | Fill in the endpoint, for example `https://yourcompany.app.nexalis.io` |
| `Nexalis READ token is missing` | Paste your token. After a **Reset** the field must be filled in again. |
| `the Nexalis READ token was rejected` | The token is wrong, or belongs to a different tenant than the URL. Check both together. |
| `the Nexalis READ token has expired` | Request a new READ token from [contact@nexalis.io](mailto:contact@nexalis.io). |
| `cannot reach the Nexalis API` | The Grafana server cannot reach the endpoint. Check DNS, egress firewall rules, and any outbound proxy. |
| `Connected, but this token can see no time series` | The endpoint and token are valid, but the token grants no read access to this tenant's data. Confirm it is a READ token issued for this endpoint. |
### A panel shows no data
Work from the widest query inwards:
1. Check the **time range**. A device that stopped reporting has no data in the last hour, however correct the filters are.
2. **Remove filters one at a time.** The one whose removal brings data back is the one that does not match. Values are case-sensitive and exact unless prefixed with `~`.
3. Make sure **no filter row has an empty value** — an empty value matches nothing.
4. Switch **Query type** to **Discover (FIND)** with the same filters and set **Return values of** to `dataPoint`. If that returns nothing, no series matches your filters at all; if it returns series, the filters are fine and the issue is the time range or the query type.
5. If a variable is involved, confirm it has a selected value — an unset variable interpolates to nothing.
### Other errors
**`too much data returned` / `response exceeded 50 MB`.** The query matched too many series or too long a range. Narrow the filters or shorten the time range. Switching from **Raw values (scaled)** to **Bucketized values** usually fixes it on its own.
**`rate limited by Nexalis (HTTP 429)`.** Too many calls in too short a window. Lower the dashboard refresh rate, or reduce the number of panels querying at once.
**`query failed on Nexalis (HTTP 500)`.** The catch-all for a WarpScript error. The rest of the message is Warp10's own, naming the function that failed — most often a **Raw WarpScript** query with a typo, or a macro called with the wrong parameters. [Common Errors](./common-errors) lists the API-level causes.
**A boolean or text tag shows as a flat line at 0 and 1.** That is expected: `Discrete` measurements such as alarm states and `nexalisConnectionStatus` are plotted as 1 for true and 0 for false. The **State timeline** visualisation reads better than a time series for these. Text-valued tags come through as text, best viewed in a **Table**.
**Gaps in a trapezoidal-average line.** The macro returns no value for a bucket with no readings and no earlier value to interpolate from, which the plugin renders as a gap. This normally only happens at the very start of a series.
***
## Learn more
* [Real-Time API](./real-time-api) — the API the plugin queries, its data structure and filtering rules
* [Nexalis Macros](./nexalis-macros) — what `@nexalis/fetch_bucketized`, `@nexalis/fetch_trapezoidal_averages` and `@nexalis/scale` do
* [Common Errors](./common-errors) — API-level errors and their causes
For plugin access and support, contact [contact@nexalis.io](mailto:contact@nexalis.io).
Everything in that panel came from the four filter rows at the bottom. Three things worth noticing, because none of them are panel settings you have to configure:
* **The y-axis reads kW.** The unit comes from the `engUnits` attribute in the Nexalis data model, applied to the field automatically.
* **The legend names itself** from the series-name template — site, asset type, measurement, device and sub-device, with any part a series does not have dropped.
* **Auto bucket** resolved to the 1-minute step Grafana asked for, shown as `Interval = 1m` under Query options. Widen the time range and the bucket widens with it, so the amount of data crossing the wire stays roughly constant.
The Grafana plugin is currently a **preview (beta)** release. Query options and the saved query format may still change between builds, so a dashboard built now may need small adjustments after an upgrade. Please send feedback and issues to [contact@nexalis.io](mailto:contact@nexalis.io).
**What you get**
* A point-and-click query editor — no WarpScript knowledge required
* Filter dropdowns populated from your own tenant, each one narrowed by the filters you already picked
* The Nexalis macros (`@nexalis/fetch_bucketized`, `@nexalis/fetch_trapezoidal_averages`, `@nexalis/scale`) exposed as query types
* Dashboard variables driven by your real site and device lists
* A raw WarpScript editor for anything the query builder does not cover
***
## Requirements
* **Grafana 12.3 or newer**, self-hosted (OSS or Enterprise)
* Access to the Grafana server's filesystem, and the ability to restart it
* A Nexalis Cloud endpoint URL and a **READ token**
* Outbound HTTPS from the Grafana server to your endpoint
The release contains backends for Linux, macOS and Windows, on both amd64 and arm64, so one download works everywhere.
**Grafana Cloud is not supported yet.** Grafana Cloud only runs plugins signed and published in the Grafana catalog, and this plugin is not yet signed. Use a self-hosted Grafana for now.
***
## Installation
Whichever way you run Grafana, the shape is the same: put the plugin folder where Grafana looks for plugins, tell Grafana to trust it because it is not signed yet, and restart. Only the mechanics differ, so pick the track that matches your setup:
* **[Grafana as a system package](#track-a-grafana-installed-as-a-package)** — installed with `apt` or `yum`, managed by `systemd`
* **[Grafana in Docker](#track-b-grafana-in-docker)** — `docker run` or Docker Compose
### Step 1: Find the latest version (both tracks)
Open the [releases repository](https://github.com/Nexalis-Organization/nexalis-grafana-plugin-releases/releases) and note the version number of the newest release — the tag looks like `v1.1.0`, and the download is `nexalis-nexalis-datasource-1.1.0.zip`.
Each release also publishes a `.zip.sha1` file if you want to verify the download:
```bash theme={null}
sha1sum -c nexalis-nexalis-datasource-1.1.0.zip.sha1
```
Whatever you do, keep the `nexalis-nexalis-datasource/` folder name from the zip. Grafana identifies a plugin by the `plugin.json` inside its own folder — renaming or flattening the folder stops it loading.
***
## Track A: Grafana installed as a package
### A1. Unzip into the plugins directory
The default is `/var/lib/grafana/plugins`. To confirm the path your server actually uses, ask Grafana — it logs every path at startup:
```bash theme={null}
journalctl -u grafana-server | grep "Path Plugins"
```
**On a fresh Grafana this directory does not exist yet.** Grafana creates `/var/lib/grafana` for its database, but `plugins/` only appears once a plugin has been installed, so `cd /var/lib/grafana/plugins` fails with *"No such file or directory"*. The `mkdir -p` below handles that.
```bash theme={null}
VERSION=1.1.0 # the version from Step 1, without the leading "v"
PLUGINS=/var/lib/grafana/plugins
sudo mkdir -p "$PLUGINS"
curl -sSL -o /tmp/nexalis-plugin.zip \
"https://github.com/Nexalis-Organization/nexalis-grafana-plugin-releases/releases/download/v$VERSION/nexalis-nexalis-datasource-$VERSION.zip"
sudo unzip -q /tmp/nexalis-plugin.zip -d "$PLUGINS"
rm /tmp/nexalis-plugin.zip
sudo chown -R grafana:grafana "$PLUGINS/nexalis-nexalis-datasource"
```
The download goes to `/tmp` as your own user, and only the unzip needs `sudo` — the plugins directory is owned by root. The final `chown` matters: Grafana runs as the `grafana` user and silently skips a plugin directory it cannot read.
You should end up with a `nexalis-nexalis-datasource/` folder containing `plugin.json`, `module.js` and several `gpx_nexalis_datasource_*` backend binaries.
### A2. Allow the plugin to load
The plugin is not signed yet, so add its ID to `grafana.ini`:
```ini theme={null}
[plugins]
allow_loading_unsigned_plugins = nexalis-nexalis-datasource
```
If you already allow other unsigned plugins, add this ID to the existing comma-separated list rather than replacing it.
### A3. Restart Grafana
```bash theme={null}
sudo systemctl restart grafana-server
```
Grafana reads `plugin.json` only at startup, so a restart is required — after this install and after every upgrade. Now jump to [Confirm Grafana found it](#confirm-grafana-found-it).
### Updating (package)
Replace the folder with the newer release and restart:
```bash theme={null}
VERSION=1.2.0 # the version you are moving to
PLUGINS=/var/lib/grafana/plugins
curl -sSL -o /tmp/nexalis-plugin.zip \
"https://github.com/Nexalis-Organization/nexalis-grafana-plugin-releases/releases/download/v$VERSION/nexalis-nexalis-datasource-$VERSION.zip"
sudo rm -rf "$PLUGINS/nexalis-nexalis-datasource"
sudo unzip -q /tmp/nexalis-plugin.zip -d "$PLUGINS"
rm /tmp/nexalis-plugin.zip
sudo chown -R grafana:grafana "$PLUGINS/nexalis-nexalis-datasource"
sudo systemctl restart grafana-server
```
Deleting the old folder rather than unzipping over it matters — it clears out files a newer release no longer ships. Your data sources and dashboards live in Grafana's own database, so they survive the upgrade untouched, and `grafana.ini` does not need changing again.
### Removing (package)
```bash theme={null}
sudo rm -rf /var/lib/grafana/plugins/nexalis-nexalis-datasource
sudo systemctl restart grafana-server
```
Then drop the ID from `allow_loading_unsigned_plugins`.
***
## Track B: Grafana in Docker
Nothing is installed *inside* the container. You unpack the plugin on the host and mount that one folder in, which means an upgrade is a host-side file swap plus a container restart.
### B1. Unpack the plugin on the host
Pick a directory you control — this example uses `./grafana-plugins` next to your `docker-compose.yml`:
```bash theme={null}
VERSION=1.1.0 # the version from Step 1, without the leading "v"
mkdir -p ./grafana-plugins
curl -sSL -o /tmp/nexalis-plugin.zip \
"https://github.com/Nexalis-Organization/nexalis-grafana-plugin-releases/releases/download/v$VERSION/nexalis-nexalis-datasource-$VERSION.zip"
unzip -q /tmp/nexalis-plugin.zip -d ./grafana-plugins
rm /tmp/nexalis-plugin.zip
chmod -R a+rX ./grafana-plugins/nexalis-nexalis-datasource
chmod +x ./grafana-plugins/nexalis-nexalis-datasource/gpx_*
```
The official `grafana/grafana` image runs as **UID 472**, not root, and host file ownership is not translated into the container. If the plugin folder is not readable by that UID, Grafana skips it with no visible error. `chmod -R a+rX` is the simplest fix; `sudo chown -R 472:472` also works. The `chmod +x` matters too — a backend plugin whose binary is not executable fails to start.
### B2. Mount it and allow it
```yaml theme={null}
services:
grafana:
image: grafana/grafana:12.3.0 # or newer; 12.3 is the minimum
ports:
- "3000:3000"
environment:
GF_PLUGINS_ALLOW_LOADING_UNSIGNED_PLUGINS: nexalis-nexalis-datasource
volumes:
- ./grafana-plugins/nexalis-nexalis-datasource:/var/lib/grafana/plugins/nexalis-nexalis-datasource
- grafana-data:/var/lib/grafana
volumes:
grafana-data:
```
`GF_PLUGINS_ALLOW_LOADING_UNSIGNED_PLUGINS` is the environment-variable form of the `grafana.ini` setting — in Docker you never edit the file.
Two details worth getting right:
* **Mount the plugin's own folder, not the whole `plugins` directory.** Mounting the parent would hide any other plugin the image ships with.
* **Give `/var/lib/grafana` a named volume.** Without it, your data sources and dashboards are inside the container's writable layer and disappear the moment you recreate it — which is exactly what an upgrade does.
The equivalent as a one-off `docker run`, useful for a quick trial:
```bash theme={null}
docker run --rm -p 3000:3000 -e GF_PLUGINS_ALLOW_LOADING_UNSIGNED_PLUGINS=nexalis-nexalis-datasource -v "$PWD/grafana-plugins/nexalis-nexalis-datasource:/var/lib/grafana/plugins/nexalis-nexalis-datasource" grafana/grafana:12.3.0
```
### B3. Start it
```bash theme={null}
docker compose up -d
```
Then jump to [Confirm Grafana found it](#confirm-grafana-found-it). If the data source is missing, the container log usually says why:
```bash theme={null}
docker compose logs grafana | grep -i nexalis
```
### Updating (Docker)
Replace the folder on the host, then restart the container. Grafana reads `plugin.json` only at startup, so the restart is what actually applies the new version:
```bash theme={null}
VERSION=1.2.0 # the version you are moving to
curl -sSL -o /tmp/nexalis-plugin.zip \
"https://github.com/Nexalis-Organization/nexalis-grafana-plugin-releases/releases/download/v$VERSION/nexalis-nexalis-datasource-$VERSION.zip"
rm -rf ./grafana-plugins/nexalis-nexalis-datasource
unzip -q /tmp/nexalis-plugin.zip -d ./grafana-plugins
rm /tmp/nexalis-plugin.zip
chmod -R a+rX ./grafana-plugins/nexalis-nexalis-datasource
chmod +x ./grafana-plugins/nexalis-nexalis-datasource/gpx_*
docker compose restart grafana
```
The compose file does not change, and neither do your data sources and dashboards as long as `/var/lib/grafana` is on a named volume.
### Removing (Docker)
Delete the `volumes:` line for the plugin from your compose file, then:
```bash theme={null}
docker compose up -d --force-recreate grafana
rm -rf ./grafana-plugins/nexalis-nexalis-datasource
```
***
## Confirm Grafana found it
In Grafana, go to **Connections → Data sources → Add new data source** and search for `Nexalis`. If it appears, the plugin is loaded — continue to [Connecting to Nexalis Cloud](#connecting-to-nexalis-cloud).
To check the version that is actually running, open **Administration → Plugins** and search for Nexalis.
If it does not appear at all, see [The Nexalis data source does not appear](#the-nexalis-data-source-does-not-appear).
***
## Connecting to Nexalis Cloud
Go to **Connections → Data sources → Add new data source** and choose **Nexalis**. There are only two fields to fill in:
| Field | Value |
| --------------- | --------------------------------------------------------------- |
| **Nexalis URL** | Your endpoint, for example `https://yourcompany.app.nexalis.io` |
| **READ token** | Your Nexalis READ token |
Then click **Save & test**.
A working configuration reports how many time series the token can see:
```
Connected — 48213 time series visible with this token
```
That number is your whole tenant, counted by the API itself — it is a quick confirmation that both the endpoint and the token are right.
Use a **READ** token. The plugin only ever queries data and never writes to your Nexalis instance.
The token is stored in Grafana's encrypted secrets store. Once saved it is write-only: the field shows `configured` and you can replace it, but neither the browser nor a dashboard viewer can read it back.
The **Nexalis URL** field accepts either the base URL (`https://yourcompany.app.nexalis.io`) or the full exec URL (`https://yourcompany.app.nexalis.io/api/v0/exec`) — the plugin normalises it either way.
### Provisioning instead of clicking
To create the data source from configuration, drop a file in Grafana's `provisioning/datasources/` directory:
```yaml theme={null}
apiVersion: 1
datasources:
- name: Nexalis
type: nexalis-nexalis-datasource
access: proxy
isDefault: true
jsonData:
nexalisUrl: https://yourcompany.app.nexalis.io
secureJsonData:
token: $NEXALIS_READ_TOKEN
```
Set `NEXALIS_READ_TOKEN` in the Grafana server's environment so the token is not committed to your configuration repository.
***
## Your first panel
This builds a chart of inverter AC power for one site, from an empty dashboard.
1. Go to **Dashboards → New → New dashboard**, then click **+ Add visualization**
2. Choose your **Nexalis** data source
The query editor opens with **Query type** set to **Bucketized values** and one empty filter row keyed on `siteName`.
3. Click the **value** box on that first filter row
The dropdown lists the real site names in your tenant. Pick one.
4. Click the **+** button at the end of the row to add a second filter. Set the key to `assetType` and the value to `INV`
5. Add a third filter: key `dataObject`, value `TotW`
6. Set the dashboard time range in the top right to **Last 6 hours**
7. Click the refresh button
You should now see one line per inverter, each named from its site, asset type, measurement and device, with the y-axis already in **kW** — the plugin reads `engUnits` from the Nexalis data model and applies it to the panel. The screenshot at the top of this page shows the same thing, narrowed further with `logicalNode` and `deviceID` filters as well.
Click **Save** to keep the dashboard.
A filter with an **empty value** matches nothing, which is why a brand-new panel shows no data until you fill in that first value. If a panel goes empty after an edit, check that every filter row you have added has a value.
Grafana's **Explore** page (in the left-hand menu) has the same query editor without the dashboard around it. It is the quickest way to try filters out, or to check that a tag has recent data, before committing to a panel.
***
## The query editor
### Query types
| Query type | What it runs | Use it for |
| ------------------------ | ------------------------------------- | ------------------------------------------------------------------------------------------------------------- |
| **Bucketized values** | `@nexalis/fetch_bucketized` | The default. Resamples into fixed buckets using `mean`, `last`, `first`, `max` or `min`. Best for dashboards. |
| **Trapezoidal averages** | `@nexalis/fetch_trapezoidal_averages` | Time-weighted averages per bucket. The accurate choice when data is sampled irregularly. |
| **Raw values (scaled)** | `FETCH` + `@nexalis/scale` | Every recorded point. Use on short time ranges only. |
| **Discover (FIND)** | `FIND` | Lists the distinct values of one label or attribute. Drives dashboard variables. |
| **Raw WarpScript** | your script | Anything the builder does not cover. |
Bucketized and trapezoidal are the two you will use most. Both aggregate server-side, so the amount of data crossing the wire stays roughly constant however long a time range you pick.
### Filters
Filters are the heart of a query. Each row is one key and one value, and all rows are combined — a query matches series that satisfy every row.
Nexalis stores two kinds of metadata on a time series, **labels** and **attributes**, and both are filterable here in exactly the same way:
| Key | Kind | Example |
| ----------------- | --------- | --------------------------------------------------------------------------- |
| `siteName` | label | `TX_001` |
| `deviceID` | label | `01234` |
| `deviceModel` | label | `Satcon` |
| `dataPoint` | label | `42`, or an OPC UA path such as `ns=2;s=[PLANT1]/PV/BLK-06/INV-06/VAL_P_KW` |
| `assetType` | attribute | `INV`, `Meter`, `MeteoSta` |
| `subDeviceID` | attribute | `BLK_001_23` |
| `logicalNode` | attribute | `MMXU`, `MMDC` |
| `dataObject` | attribute | `TotW`, `PhV` |
| `subDataObject` | attribute | `phsA` |
| `measurementType` | attribute | `Analog`, `Discrete` |
See [Data Structure](./real-time-api#data-structure) for what each one means.
Both the key and the value dropdowns are populated from your tenant, and **the value list is narrowed by the filters you have already set** — pick `siteName` first and the `assetType` dropdown then offers only the asset types that exist at that site. Building a query top to bottom keeps every choice valid.
You can also type instead of picking:
* **A Warp10 regular expression**, prefixed with `~` — `~INV-(1|2)`, `~^TX_`, `~.*_001$`. See [Filtering Data](./real-time-api#filtering-data).
* **A dashboard variable** — `$site`. See [Dashboard variables](#dashboard-variables) below.
If a value list is longer than the plugin will show at once, it tells you so in the dropdown; type to search, or add another filter to narrow it.
### Bucket size
**Auto bucket** is on for new queries. The bucket width then follows the panel's time range and width the way Grafana's `$__interval` does, snapping to a fixed ladder — 1, 2, 5, 10, 15, 30, 60, 120, 180, 360, 720 or 1440 minutes — so buckets do not shift around as you resize a panel.
Turn **Auto bucket** off to pin a width in minutes, which is what you want when a number has to mean something specific: 15-minute averages for a settlement report, say, regardless of how the panel is displayed.
### Bucketizer
For **Bucketized values**, the **Bucketizer** field decides how the points inside each bucket are reduced to one value:
| Bucketizer | Result |
| ------------- | ------------------------------------------------------------------------------ |
| `mean` | Arithmetic average of the points in the bucket. The default. |
| `last` | The most recent point in the bucket — best for counters, states and totalisers |
| `first` | The earliest point in the bucket |
| `max` / `min` | The extreme value in the bucket — for peaks and dips a mean would hide |
If what you actually need is a *time-weighted* average — the true average of the signal over the bucket, rather than of the samples — use the **Trapezoidal averages** query type instead. On irregularly-sampled tags the two give different answers, and the trapezoidal one is the correct one.
### Scaling
**Scaling** is on by default and applies `@nexalis/scale`, which converts each raw SCADA value into the engineering units of the Nexalis data model using the `multiplier` and `adder` attributes — watts to kilowatts, for instance. Leave it on unless you specifically want the raw stored values.
Scaling is not idempotent. If you write a **Raw WarpScript** query, call `@nexalis/scale` exactly once — `@nexalis/fetch_bucketized` and `@nexalis/fetch_trapezoidal_averages` already apply it for you.
### Series name
**Series name** controls the legend. It is a template with `${...}` placeholders, and any label or attribute can be used:
```
${siteName} · ${assetType} · ${dataObject} · ${deviceID} · ${subDeviceID}
```
That is the default. Placeholders that a series does not have are dropped, along with the separator around them, so you never get a legend full of gaps. Shorten it to just what distinguishes your series — with one site and one measurement on a panel, `${subDeviceID}` alone is usually the readable choice.
***
## Dashboard variables
A variable turns a hard-coded filter into a dropdown at the top of the dashboard.
1. Open **Dashboard settings → Variables → Add variable**
2. Set **Select variable type** to **Query** and give it a name, for example `site`
3. Choose your **Nexalis** data source
4. Set **Query type** to **Discover (FIND)**
5. Set **Return values of** to `siteName`
6. Check the preview at the bottom of the page — it lists your actual site names
7. **Apply**, then use it in any panel by typing `$site` as a filter value
The same works for any key: point **Return values of** at `assetType`, `deviceID` or `dataObject` to build those dropdowns. Add filters to the variable query to make one variable depend on another — give the `deviceID` variable a filter of `siteName` = `$site`, and it will only ever list devices at the selected site.
**Multi-value and "All"** work. The plugin translates a multiple selection into a Warp10 regular expression (`~^(TX_001|TX_002)$`), because Warp10 has no list syntax of its own. You do not have to do anything — write `$site` as the filter value and select as many as you like.
***
## Raw WarpScript
Choose **Raw WarpScript** as the query type to write the script yourself. The filter builder is hidden — your script defines its own selectors. The plugin injects your saved token and the panel's time range, so a script can be moved between dashboards and time ranges unchanged:
| Variable | Contents |
| ----------------------- | ------------------------------------------- |
| `$token` | The configured READ token |
| `$start` / `$end` | The panel's time range, in microseconds |
| `$startISO` / `$endISO` | The same range as ISO 8601 strings |
| `$interval` | The step Grafana asked for, in microseconds |
| `$span` | `end` − `start`, in microseconds |
```warpscript theme={null}
{
'token' $token
'class' 'nx.value'
'labels' { 'siteName' 'TX_001' 'dataObject' 'TotW' }
'start' $startISO
'end' $endISO
} FETCH
@nexalis/scale
```
Leave Geo Time Series on the stack and the plugin turns them into panel series, exactly as it does for the built-in query types. Anything the [real-time API](./real-time-api) accepts works here, including your own macros.
***
## Query performance
Nexalis is a time-series database: it is fast at reading **one tag over a long period**, and slow at reading many tags at once. The [best practices](./real-time-api#best-practices) apply directly to how you build panels.
* **Filter as narrowly as you can.** Every filter you add cuts the number of series the API has to scan. Always set `siteName`; add `deviceID` or `dataPoint` when you know them.
* **One chart, one question.** A panel filtered only by `siteName` and `assetType` can match thousands of series. When a query returns more than 500, the panel shows a warning explaining that this is why it is slow — treat it as a prompt to add a filter, not as an error.
* **Prefer the aggregating query types.** Bucketized and trapezoidal aggregate server-side. **Raw values (scaled)** returns every recorded point, which on a high-frequency tag over a week is an enormous amount of data.
* **Mind the dashboard refresh rate.** Every panel is a separate API call. A dashboard of twenty panels refreshing every ten seconds is 120 calls a minute, which can hit your rate limit.
***
## Troubleshooting
### The Nexalis data source does not appear
Grafana logs a reason at startup. Check it first — it usually names the problem outright:
```bash theme={null}
journalctl -u grafana-server | grep -i plugin # package install
docker compose logs grafana | grep -i plugin # Docker
```
Then work through:
* **Was Grafana restarted** after the plugin was unzipped? `plugin.json` is read only at startup.
* **Is the folder in the right place**, and still named `nexalis-nexalis-datasource`? The `plugin.json` must be at `/nexalis-nexalis-datasource/plugin.json`, not one level deeper. Unzipping a second time can produce a nested duplicate folder.
* **Is the plugin allowed?** A signature error in the log means `allow_loading_unsigned_plugins` is missing the ID, or — in Docker — that `GF_PLUGINS_ALLOW_LOADING_UNSIGNED_PLUGINS` is missing or misspelled.
* **Are the backend binaries executable?** A "failed to start plugin" error usually means the `gpx_*` files lost their executable bit. Run `chmod +x /nexalis-nexalis-datasource/gpx_*`.
* **Can Grafana read the folder?** On a package install it must be readable by the `grafana` user. In Docker it must be readable by **UID 472**, which host ownership does not translate to — `chmod -R a+rX` on the host folder is the quick fix.
* **In Docker, is the mount actually there?** Confirm what the container sees:
```bash theme={null}
docker compose exec grafana ls -l /var/lib/grafana/plugins/nexalis-nexalis-datasource
```
An empty or missing directory means the `volumes:` path is wrong — it is resolved relative to the compose file, not to your shell.
### "Save & test" fails
| Message | What to do |
| -------------------------------------------------- | ------------------------------------------------------------------------------------------------------------------------------------------------- |
| `Nexalis URL is missing` | Fill in the endpoint, for example `https://yourcompany.app.nexalis.io` |
| `Nexalis READ token is missing` | Paste your token. After a **Reset** the field must be filled in again. |
| `the Nexalis READ token was rejected` | The token is wrong, or belongs to a different tenant than the URL. Check both together. |
| `the Nexalis READ token has expired` | Request a new READ token from [contact@nexalis.io](mailto:contact@nexalis.io). |
| `cannot reach the Nexalis API` | The Grafana server cannot reach the endpoint. Check DNS, egress firewall rules, and any outbound proxy. |
| `Connected, but this token can see no time series` | The endpoint and token are valid, but the token grants no read access to this tenant's data. Confirm it is a READ token issued for this endpoint. |
### A panel shows no data
Work from the widest query inwards:
1. Check the **time range**. A device that stopped reporting has no data in the last hour, however correct the filters are.
2. **Remove filters one at a time.** The one whose removal brings data back is the one that does not match. Values are case-sensitive and exact unless prefixed with `~`.
3. Make sure **no filter row has an empty value** — an empty value matches nothing.
4. Switch **Query type** to **Discover (FIND)** with the same filters and set **Return values of** to `dataPoint`. If that returns nothing, no series matches your filters at all; if it returns series, the filters are fine and the issue is the time range or the query type.
5. If a variable is involved, confirm it has a selected value — an unset variable interpolates to nothing.
### Other errors
**`too much data returned` / `response exceeded 50 MB`.** The query matched too many series or too long a range. Narrow the filters or shorten the time range. Switching from **Raw values (scaled)** to **Bucketized values** usually fixes it on its own.
**`rate limited by Nexalis (HTTP 429)`.** Too many calls in too short a window. Lower the dashboard refresh rate, or reduce the number of panels querying at once.
**`query failed on Nexalis (HTTP 500)`.** The catch-all for a WarpScript error. The rest of the message is Warp10's own, naming the function that failed — most often a **Raw WarpScript** query with a typo, or a macro called with the wrong parameters. [Common Errors](./common-errors) lists the API-level causes.
**A boolean or text tag shows as a flat line at 0 and 1.** That is expected: `Discrete` measurements such as alarm states and `nexalisConnectionStatus` are plotted as 1 for true and 0 for false. The **State timeline** visualisation reads better than a time series for these. Text-valued tags come through as text, best viewed in a **Table**.
**Gaps in a trapezoidal-average line.** The macro returns no value for a bucket with no readings and no earlier value to interpolate from, which the plugin renders as a gap. This normally only happens at the very start of a series.
***
## Learn more
* [Real-Time API](./real-time-api) — the API the plugin queries, its data structure and filtering rules
* [Nexalis Macros](./nexalis-macros) — what `@nexalis/fetch_bucketized`, `@nexalis/fetch_trapezoidal_averages` and `@nexalis/scale` do
* [Common Errors](./common-errors) — API-level errors and their causes
For plugin access and support, contact [contact@nexalis.io](mailto:contact@nexalis.io).