
NEXALIS.* worksheet functions that stay live and recalculate with the sheet — so a workbook can be refreshed rather than rebuilt.
The add-in talks to the real-time API at {endpoint}/api/v0/exec over WarpScript. There is no server component to deploy — you install the add-in, save a connection, and start pulling data.
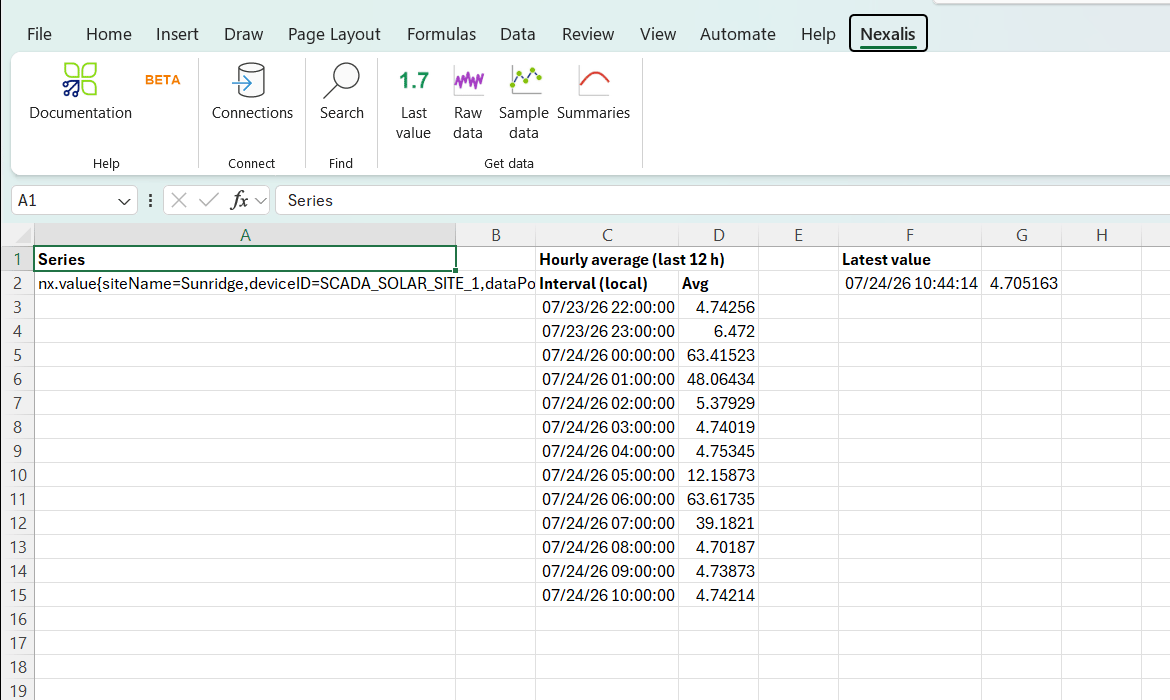
The Excel add-in is currently a preview (beta) release. Features and function arguments may still change between builds.
Requirements
- Windows
- Desktop Excel, 64-bit (Microsoft 365, 2016, 2019 or 2021)
- A Nexalis Cloud endpoint URL and a read token
Installation
Step 1: Download
Download the latestNexalis-AddIn-beta.zip from the releases repository.
Step 2: Run the installer
- Unzip the download, keeping all the files together in one folder
- Double-click Install Nexalis add-in.bat
- Windows shows a blue “Windows protected your PC” box — click More info, then Run anyway
- Close Excel completely, then reopen it
The security prompt appears because this preview build is signed with an in-house certificate rather than a public commercial one. The prompt is shown once, when you run the installer.
Step 3: Confirm
Reopen Excel and look for the Nexalis tab in the ribbon. If it is missing, make sure Excel was fully closed first — a backgroundEXCEL.EXE process left running in Task Manager will keep the old session alive. You can also load the add-in for the current session from the Load Nexalis add-in Start-menu shortcut.
If your Excel is configured to require add-ins signed by a trusted publisher, run Trust Nexalis publisher.bat once (included in the zip) and restart Excel.
Updating
To update, run Install Nexalis add-in.bat again from the newer zip, then restart Excel. To remove the add-in, run Uninstall Nexalis add-in.bat.Connecting to Nexalis Cloud
Connections are saved per Windows user, so each person configures their own once.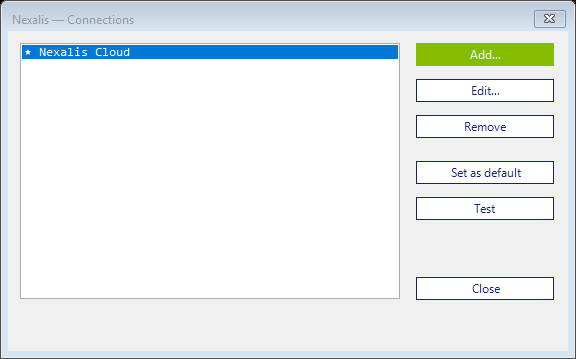
- On the Nexalis ribbon tab, click Connections
- Click Add, then fill in:
- Name — a short label, for example
Production - URL — your Nexalis Cloud base URL, for example
https://yourcompany.app.nexalis.io - Token — your Nexalis read token
- Name — a short label, for example
- Click Test to verify the endpoint answers and accepts the token
- Click Set as default so new formulas use this connection
%APPDATA%\Warp10AddIn\endpoints.json. Tokens are masked in the interface.
Use a read token. The add-in only queries data and never writes to your Nexalis instance.
The Nexalis ribbon

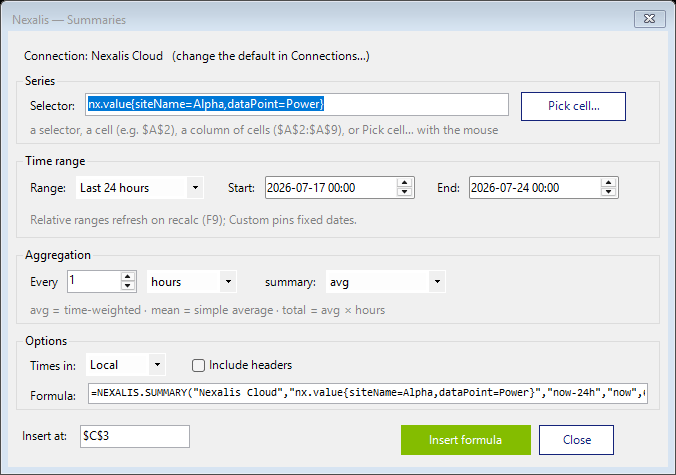
Each button opens a small window where you choose the series and the time range, previews the formula it will write, and inserts it at the cell you pick.
Finding your time series
Click Search to browse what is available on your connection.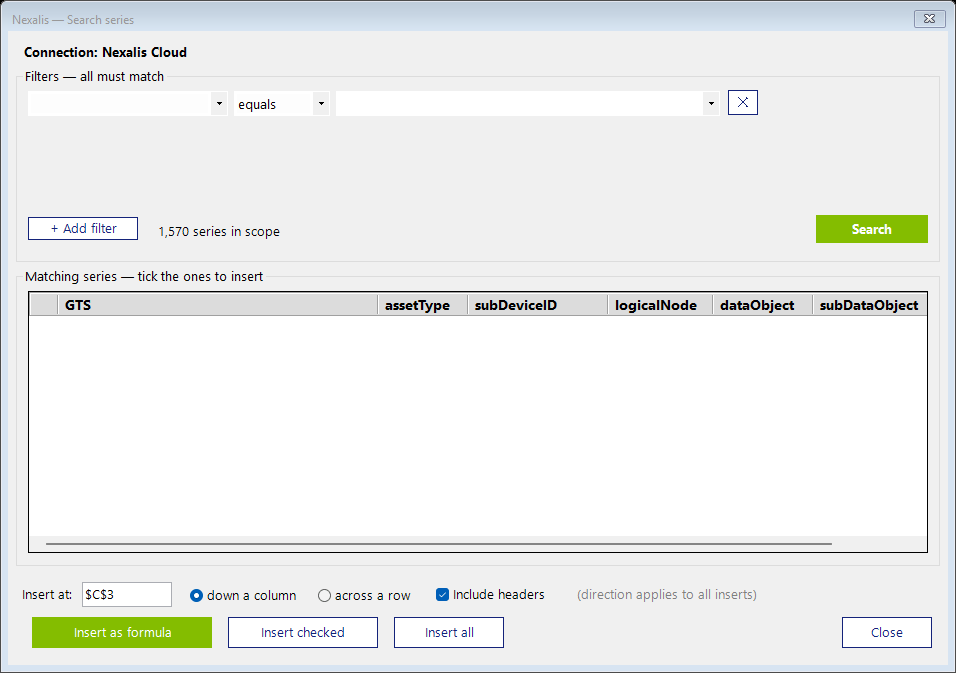
- Add one or more filters — pick a field (a label or attribute such as
siteName,assetTypeordataPoint), an operator (equals or contains), and a value - Values are offered in a dropdown listing what actually exists in the narrowed set, so filters can be stacked to drill down
- Click Search to list the matching series
assetType, subDeviceID, logicalNode, dataObject, subDataObject and engUnits.
You can then insert the result three ways:
- Insert as formula — writes a live
=NEXALIS.FIND(...)built from your filters. The search criteria stay visible and editable in the cell, and the list refreshes when the sheet recalculates. - Insert checked — writes the selectors of the rows you ticked, as static text
- Insert all — writes every matching selector, as static text
Inserting as a formula is the recommended approach: the search scope is recorded in the sheet, so you can see later what a list of series was based on — and change it without redoing the search.
Worksheet functions
Every function takes the connection name as its first argument, and a selector identifying the series. A selector looks likenx.value{siteName=Alpha,dataPoint=...} — copy one from NEXALIS.FIND, or point the formula at a cell that contains one.
Selectors are long, so most workbooks keep them in one place and reference them. The cell (or range) you point at can live on another sheet in the same workbook — for example Tags!$A$2 or Tags!$A$2:$A$20. A common layout is a dedicated Tags sheet holding the series list, with the reporting sheets referencing it.
NEXALIS.FIND
labels and attributes are comma-separated filters such as siteName=Alpha or dataPoint=~.*INV.* (a ~ prefix makes the value a regular expression).
- With headers
TRUE, the result is a table: the GTS selector followed by one column per field, with a header row.fieldsdefaults toassetType, subDeviceID, logicalNode, dataObject, subDataObject, engUnits. - With headers
FALSE, the result is a single column of GTS selectors — convenient to feed straight into the functions below. - Set across
TRUEto lay the result out across a row instead of down a column.
NEXALIS.LAST
NEXALIS.FETCH
start and end (both included), as rows of timestamp and value. The selector must identify a single series.
NEXALIS.SAMPLE
Returns interpolated values at times you choose, which is useful when several series are recorded at different moments and you need them lined up on a common time base.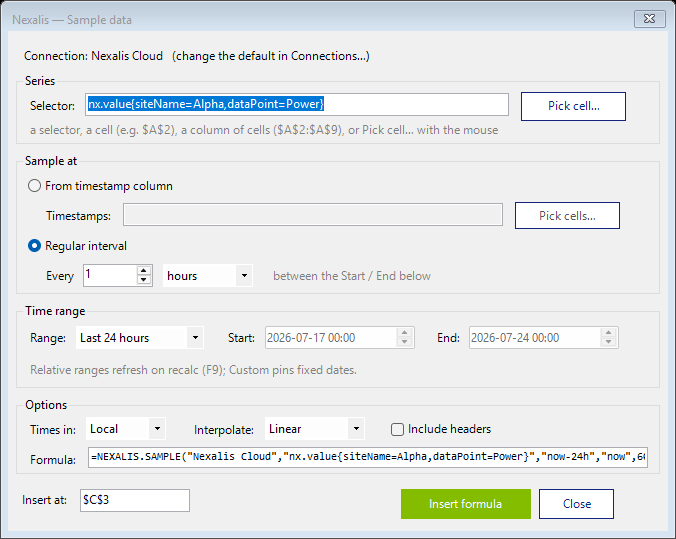
method is either linear (a straight line between the two surrounding recorded points) or step (carry the last known value forward). Times that fall outside the recorded data are returned blank rather than extrapolated.
NEXALIS.SUMMARY
mode is one of avg, total, min, max, mean, first or last.
avg is time-weighted (the average of the signal over the bucket), mean is the plain arithmetic average of the recorded points, and total is avg multiplied by the bucket length in hours — the usual choice for energy from a power series.
Utility functions
Time inputs
Anywhere a time is expected you can give a date, a cell containing a date, or relative text:
Units are
s (seconds), m (minutes), h (hours), d (days), w (weeks) and mo (months).
Relative times are plain text, so they are non-volatile: they resolve when the formula recalculates rather than continuously, which avoids the recalculation loops that volatile functions cause in large workbooks. Press F9 to refresh.
Working with several series at once
NEXALIS.SUMMARY and NEXALIS.SAMPLE accept a range of selector cells instead of a single selector. They then return an aligned matrix: one timestamp column, then one value column per series, all sharing the same time base.
NEXALIS.FIND: use a FIND formula with headers off to produce a live column of selectors, then point a SUMMARY or SAMPLE formula at that column. Changing the search filters updates the series list, and the data below follows.
Editing an existing formula
Right-click any cell containing aNEXALIS.* formula and choose Edit Nexalis formula…. The window it was built with reopens, pre-filled with the connection, series, time range and options from the formula. Adjust anything and insert again to rewrite it in place.
This works for LAST, FETCH, SAMPLE and SUMMARY formulas, and for FIND formulas inserted from Search.
Troubleshooting
The Nexalis tab does not appear. Close Excel completely and confirm noEXCEL.EXE remains in Task Manager, then reopen it. Otherwise load it for the session from the Load Nexalis add-in Start-menu shortcut. If Excel is set to require signed add-ins, run Trust Nexalis publisher.bat from the zip.
A formula returns “No series matched”. The selector may not exist on that connection. Check it with Search, or confirm you are pointing at the right connection — formulas name their connection explicitly, which may not be your default.
A formula shows a warning starting with ⚠. The message explains what to correct, most often a missing selector or a time range whose end falls before its start.
Cells stay blank while a query runs. Queries run in the background so Excel stays responsive; values appear when the data arrives. A blank cell in a SAMPLE result means there was no recorded data around that time to interpolate from.
Values display as dates, or dates display as numbers. The add-in formats timestamp columns as dates and value columns as General when a result spills. If you have applied your own formatting to those cells, it may conflict — clear the formatting and let the formula respill.